design research, strategy, prototyping
Ejido Verde
Changing the measurements of success
Project executed during Social Systems Interventions class at IIT Institute of Design.
Ejido Verde is a Mexican regenerative pine resin supply company forged through a partnership between the pine resin industry and rural indigenous communities. In the first half we focused on scoping the system we wanted to work on and in the second half we analyzed its granularity, redesigned their regenerative dashboard as well as envisioned a theory of change.
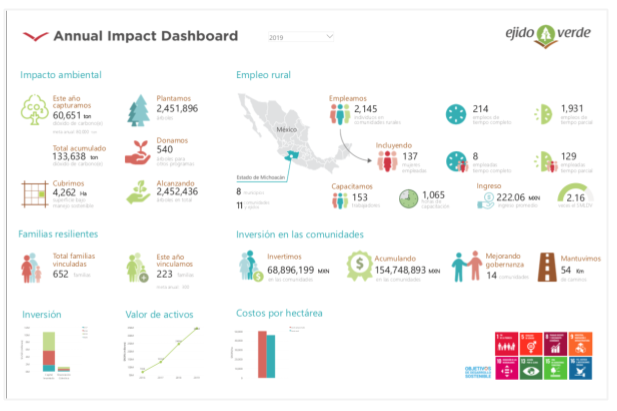
What is the Regenerative Impact Dashboard?
Impact dashboards are important because they help organizations keep track of their impact and attract external funding. Investors rely on these and other metrics to decide what organization to fund. Ejido Verde’s regenerative dashboard follows a different methodology that improves upon traditional impact dashboards. It compiles together standard B-Corps metrics along with new methods of measuring that are important within the living system their organization works within.
Ejido Verde’s current effort to broaden the definition of value and revamp the pine forestry industry practices by systematically measuring and reporting their impact is promising. There are opportunity areas to explore for their dashboard to take off and scale its adoption.
Our team worked on two levels where design and Design come together:
_ Part I: Systems Design strategy: systems thinking for envisioning change in niche, regime and landscape levels.
_ Part II: Tactical design strategy: leveraged a valuable piece (Regenerative Dashboard) so that it is ready to be scaled and adopted by multiple stakeholders.

In order to better understand the challenge, we talked with:

We realized that...
“We’ve noticed nothing in metrics today that values indigenous cultures.”
1/ approachability is key
The dashboard can be improved to be approachable for all of Ejido Verde’s audiences.
Some investors might be interested in further detail. Eg. kind of training, or data disaggregated by gender.
2/ transparency is required
Metrics definitions and how they are being tracked and collected are not clearly defined in the dashboard or in the methodology presentation.
3/ storytelling is treasured
There is a huge potential for storytelling to be embedded into the current dashboard.
The dashboard could also be adapted to tell the story in Kiva.
4/ industry reference is necessary
Current metrics are difficult to compare, thus making it difficult for decision-makers to benchmark against the forestry industry or other related industries.

Part I: Systems Design strategy: systems thinking for envisioning change in niche, regime and landscape levels
How might Ejido Verde disrupt the impact investing system and leverage Regenerative criteria?
How can the dashboard, as a niche agent, influence and transform regime infrastructures for a more regenerative future? In order to understand the impact investing system, we made a multi-level perspective analysis:

We learned that system change trajectories for investment metrics often need a platform partner (aggregator) to get the metrics widely adopted. According to an impact investing expert:
“Only when there's an agent who starts collecting this information across lots of companies - and delivering ranking or publishing about the performance on these metrics - does anyone really start to pay attention.”
Thus, the challenge is to see where there might be an aggregator interested in working on creating debt (instead of equity) opportunities for privately held companies that are high performers across regenerative criteria. And, ideally, that player has access to the kinds of entities who want to invest in socially responsible lending, usually foundations or educational institutions.
That being said, Ejido Verde could envision different partnerships for different targets. Below are initial opportunities for EV to scale their regenerative dashboard:

Part II: Tactical design strategy: leveraged a valuable piece (Regenerative Dashboard) so that it is ready to be scaled and adopted by multiple stakeholders.

“We not only look at numbers. We are also looking how they are being more inclusive. For instance, how are they including women in the operation.”
“There are different types of investors, you need to talk differently to each one and know what drives them. It could be the drink you ordered.”
Further Reflections
A/ Systemic change pathways: there are the different ways to drive systemic change: the dashboard is one of them.
D/ Customized metrics: currently the dashboard approaches all of the investors with the same metrics, a future version of the dashboard could include customized metrics in order to respond to different investors interests and drivers.
B/ Traceability: connect long-term plantation journey with stories of indigenous families and biodiversity impact.
E/ Frame the story in a more impactful way: tailor the story being told when presenting the dashboard to achieve deeper connection with investors. A fund manager’s motivations might differ from a wealthy family or a foundation.
C/ Systems change for indigenous communities: what is the system change that indigenous communities want?
F/ Co-design with investors: gather further insights of how the dashboard might be constantly improved to help them make better decisions.
SPECIAL THANKS TO THE WHOLE TEAM
Institute of Design Master candidates: Catalina Prada, Julia Rochlin and Brian Siegfried
Institute of Design Faculty/Advisors: Cheryl Dahle and Chris Rudd
Ejido Verde team: Shaun Paul, Xitlali Ferreyra and Hiara Ruiz Duque